
Bitcoin price has recovered above the $60,000 resistance zone. BTC is now struggling to clear the $61,200 and $61,500 resistance levels.
- Bitcoin has started a recovery wave above the $60,000 resistance zone.
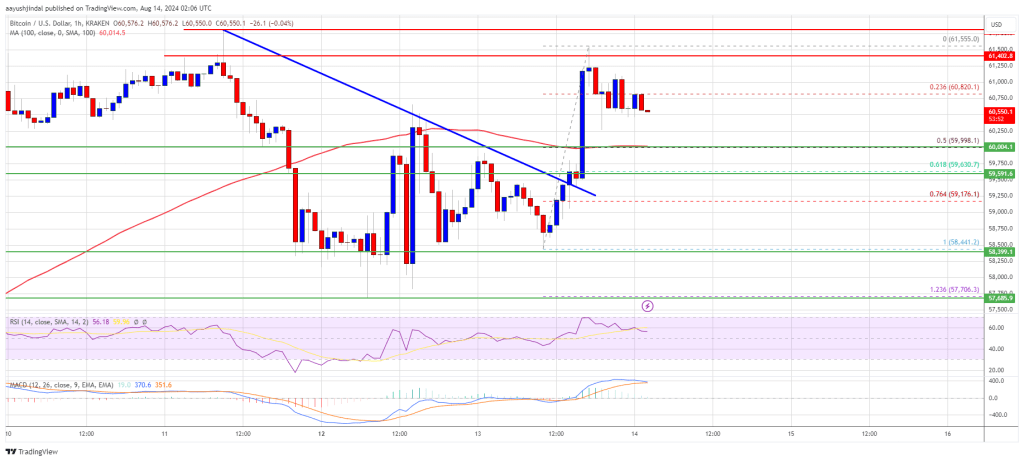
- The price is trading above $60,000 and the 100 hourly simple moving average.
- There was a break above a descending trend line with resistance at $59,500 on the hourly chart of the BTC/USD pair (data feed from Kraken).
- The pair could attempt a fresh increase if it stays above the $61,500 resistance zone.
Bitcoin Price Gains Momentum
Bitcoin price started a decent upward movement above the $58,500 resistance zone. BTC managed to overcome the $59,500 and $60,000 resistance levels.
There was a break above a descending trend line with resistance at $59,500 on the hourly chart of the BTC/USD pair. It even crossed above the $61,500 level. A high was formed at $61,555 and the price is now correcting gains.
There was a move below the $61,200 and $61,000 levels. The price fell below the 23.6% Fibonacci retracement level of the upward move from the $58,441 swing low to $61,555 high.
Bitcoin price is now trading above $60,000 and the 100-hour simple moving average. It is also well above the 50% Fib retracement level of the upward move from the $58,441 low to $61,555 high. On the upside, the price could face resistance near the $61,200 level.
The first key resistance is near the $61,500 level. A clear move above the $61,500 resistance could push the price higher in the coming sessions. The next key resistance could be at $62,500.
The next major hurdle is at $63,500. A close above the $63,500 resistance could lead to further upside. In this case, the price could move higher and test the $65,000 resistance.
Another BTC crash?
If Bitcoin fails to climb above the $61,500 resistance zone, it could start another decline. Immediate support on the downside is near the $60,000 level and the 100 hourly simple moving average.
The first major support is at $59,650. The next support is now near the $59,150 zone. Any more losses could send the price towards the $58,500 or even $57,200 support zone in the near term.
Technical indicators:
Hourly MACD – The MACD is now losing momentum in the bullish zone.
Hourly RSI (Relative Strength Index) – The RSI for BTC/USD is now above the 50 level.
Key support levels – $60,000, followed by $59,650.
Key Resistance Levels – $61,200 and $61,500.


 Martinou: Finally, congratulations to the great captain")
